This function is a wrapper around plot.igraph, written
to group parasite genotypes by episode both spatially and using vertex
colour (specifically, parasite genotypes within episodes are vertically
distributed with some horizontal jitter when layout.by.group = TRUE
(default), and equicolored), and to ensure clone and sibling edges
are plotted using different line types.
Arguments
- RG
igraphobject encoding an RG; seeRG_to_igraph.- layout.by.group
Logical; if TRUE (default) overrides the default layout of
plot.igraphso that vertices that represent parasite genotypes from different episodes are distributed horizontally and vertices that represent genotypes within episodes are distributed vertically.- vertex.palette
A character string specifying an RColorBrewer palette. Overrides the default
paletteofplot.igraph.- edge.lty
Named vector of edge line types corresponding to different relationships.
- edge.col
Named vector of edge colours corresponding to different relationships.
- edge.width
Overrides the default
edge.widthofplot.igraph.- ...
Additional arguments to pass to
plot.igraph, e.g.,edge.curved.
Details
To see how to plot relationship graphs outputted by
compute_posterior, please refer to Exploration of relationship graphs in
Demonstrate Pv3Rs usage
.
Provenance
This function was adapted from plot_Vivax_model at
https://github.com/jwatowatson/RecurrentVivax/blob/master/Genetic_Model/iGraph_functions.R.
Examples
RGs <- enumerate_RGs(c(2, 1, 1), progress.bar = FALSE)
#> Number of valid relationship graphs (RGs) is 48
oldpar <- par(no.readonly = TRUE) # record user's options
par(mfrow = c(3, 4), mar = c(0.1, 0.1, 0.1, 0.1))
for (i in 12:23) {
plot_RG(RGs[[i]],
edge.col = c(sibling = "gray", clone = "black"),
edge.lty = c(sibling = "dotted", clone = "solid"),
edge.curved = 0.1)
box()
}
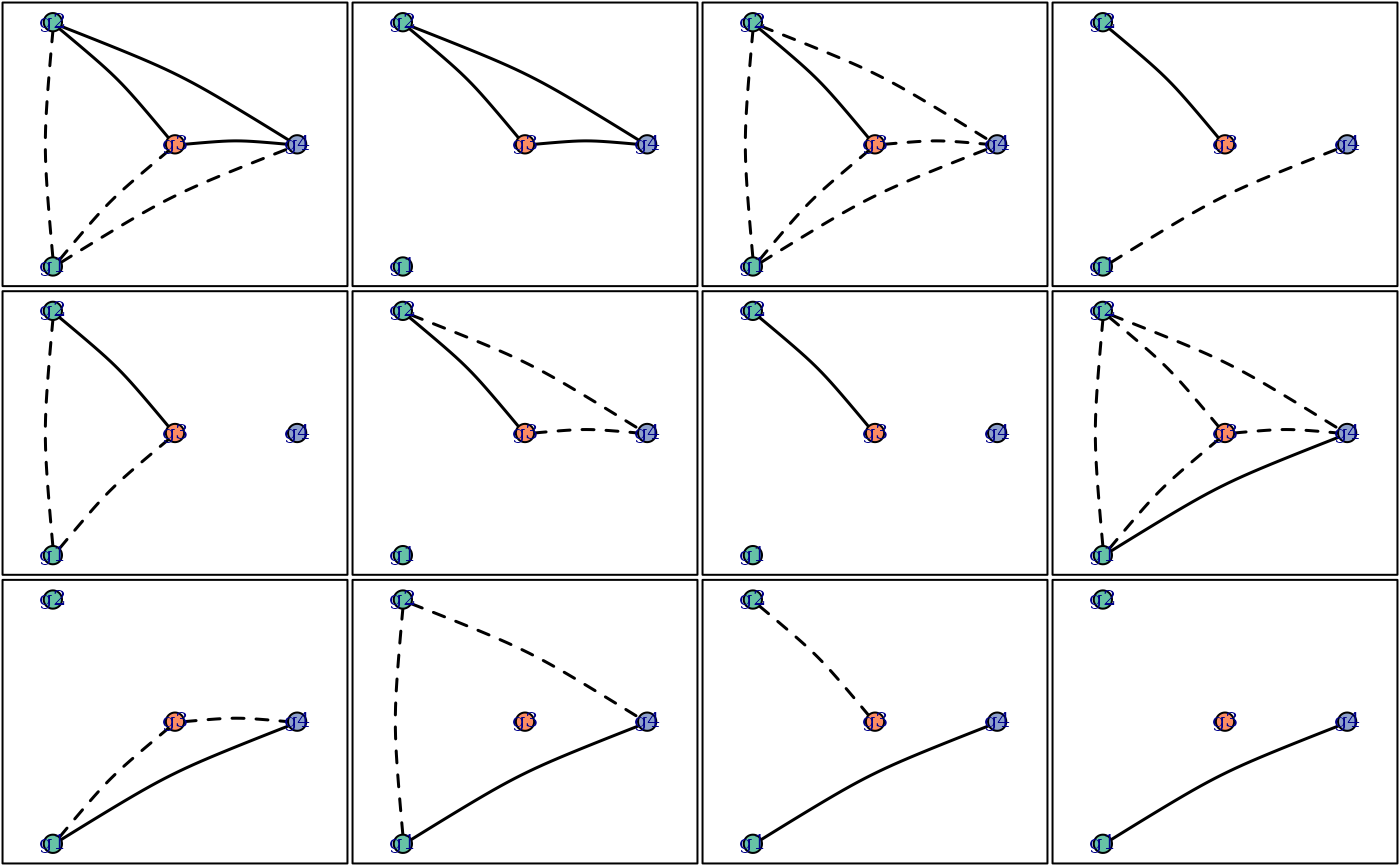 par(oldpar) # restore user's options